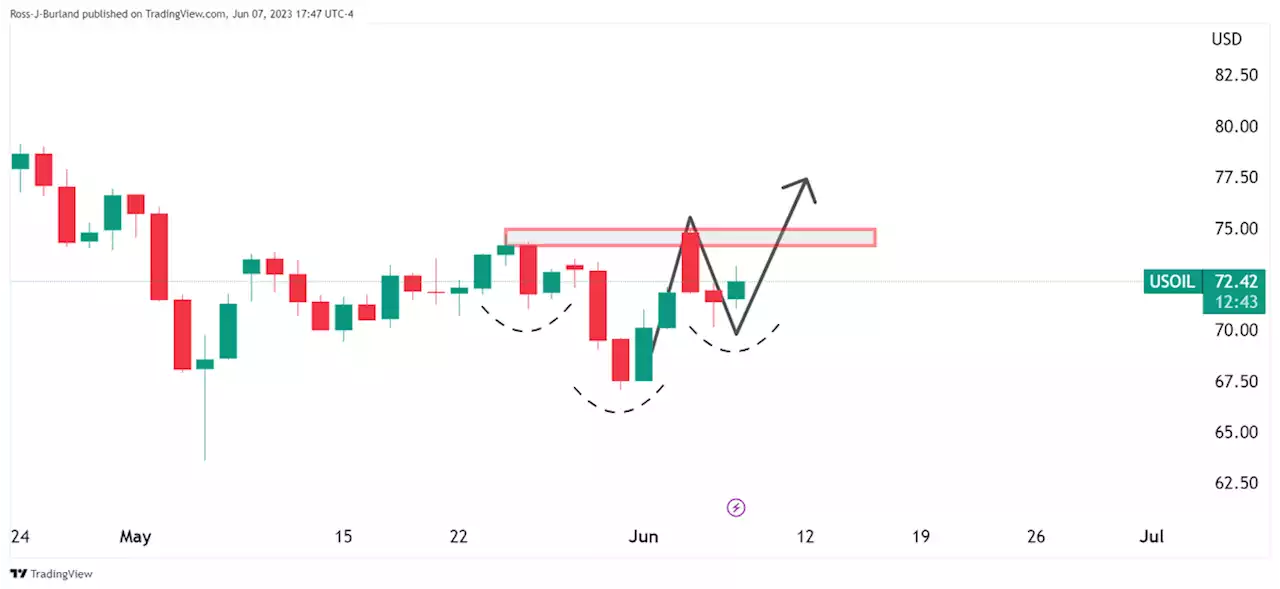
WTI Price Analysis: Bullish H&S in the making on daily chart Oil WTI Commodities
ended higher on Wednesday as a report showed an unexpected drop in US inventories while China's imports rose last month. Nevertheless, the bulls remain in good stead as per the following technical analysis:across to see the impulse correction and what could now be another bullish impulse in the making, we can see that the market is supported at a 61.8% Fibonacci retracement level. This too is bullish.
If not otherwise explicitly mentioned in the body of the article, at the time of writing, the author has no position in any stock mentioned in this article and no business relationship with any company mentioned. The author has not received compensation for writing this article, other than from FXStreet.
FXStreet and the author do not provide personalized recommendations. The author makes no representations as to the accuracy, completeness, or suitability of this information. FXStreet and the author will not be liable for any errors, omissions or any losses, injuries or damages arising from this information and its display or use. Errors and omissions excepted.
The author and FXStreet are not registered investment advisors and nothing in this article is intended to be investment advice.
United States Latest News, United States Headlines
Similar News:You can also read news stories similar to this one that we have collected from other news sources.
 WTI Price Analysis: Oil retakes the 20-day SMA amid OPEC cuts rumoursWTI rebounded at a daily low of $70.17 and managed to recover the 20-day SMA at $71.67 Rumors of further production cuts by the OPEC give traction to
Read more »
 GBP/JPY Price Analysis: Faces pullback as rising wedge emerges despite bullish indicatorsGBP/JPY registers back-to-back negative sessions, sponsored by risk aversion; though technical indicators suggest further upside, price action means t
Read more »
 USD/CAD Price Analysis: Bears about to make a move at courageous bullish recoveryThe Canadian Dollar popped to a four-week high vs. the Greenback on Wednesday after the Bank of Canada said it would continue to raise interest rates
Read more »
 EUR/USD Price Analysis: Euro struggles to defend corrective bounce off 1.0700EUR/USD Price Analysis: Euro struggles to defend corrective bounce off 1.0700 EURUSD Technical Analysis ChartPatterns SwingTrading SupportResistance
Read more »
 AUD/USD Price Analysis: Bulls eye 0.6660 resistance confluence and RBA Interest Rate DecisionAUD/USD Price Analysis: Bulls eye 0.6660 resistance confluence and RBA Interest Rate Decision AUDUSD RBA Technical Analysis ChartPatterns SwingTrading
Read more »
 Silver Price Analysis: XAG/USD retreats from key EMA hurdles below $24.00Silver Price Analysis: XAG/USD retreats from key EMA hurdles below $24.00 Silver XAGUSD Technical Analysis ChartPatterns SupportResistance Silver
Read more »