
Crypto Blog
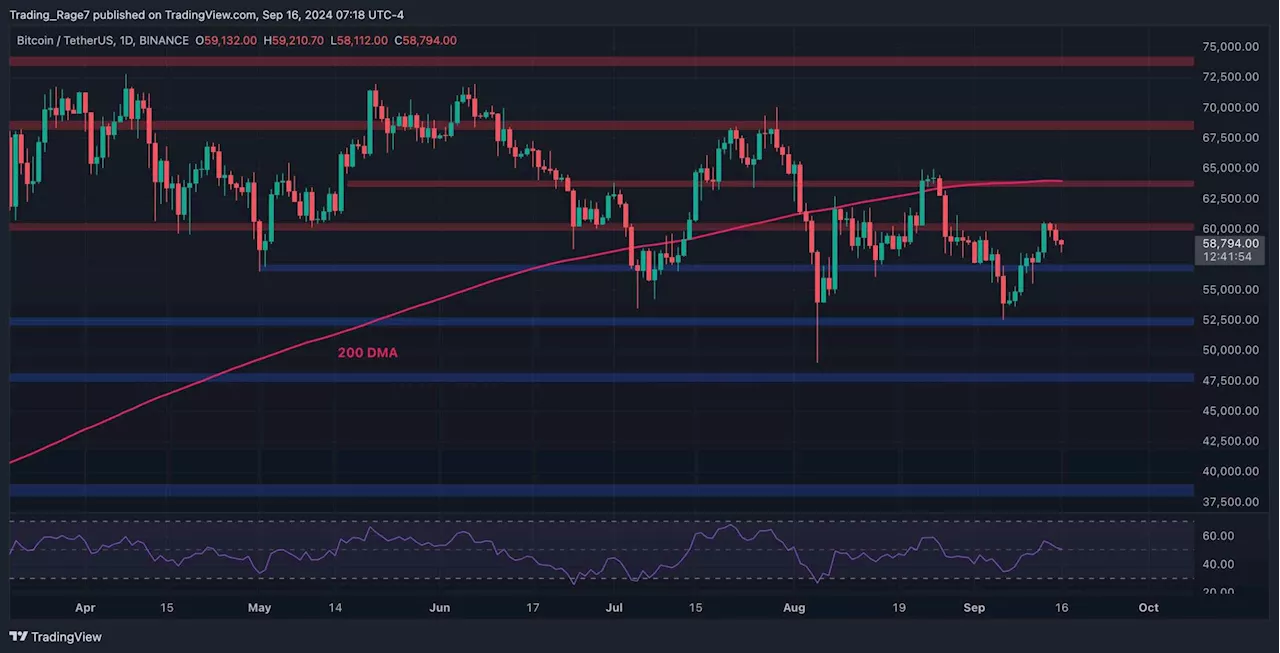
Bitcoin’s price is finally showing some promising signs of bullish continuation. The big question now is if the consolidation period is over or if this is just a temporary bounce.On the daily chart, BTC has been consolidating below the 200-day moving average for some time now.
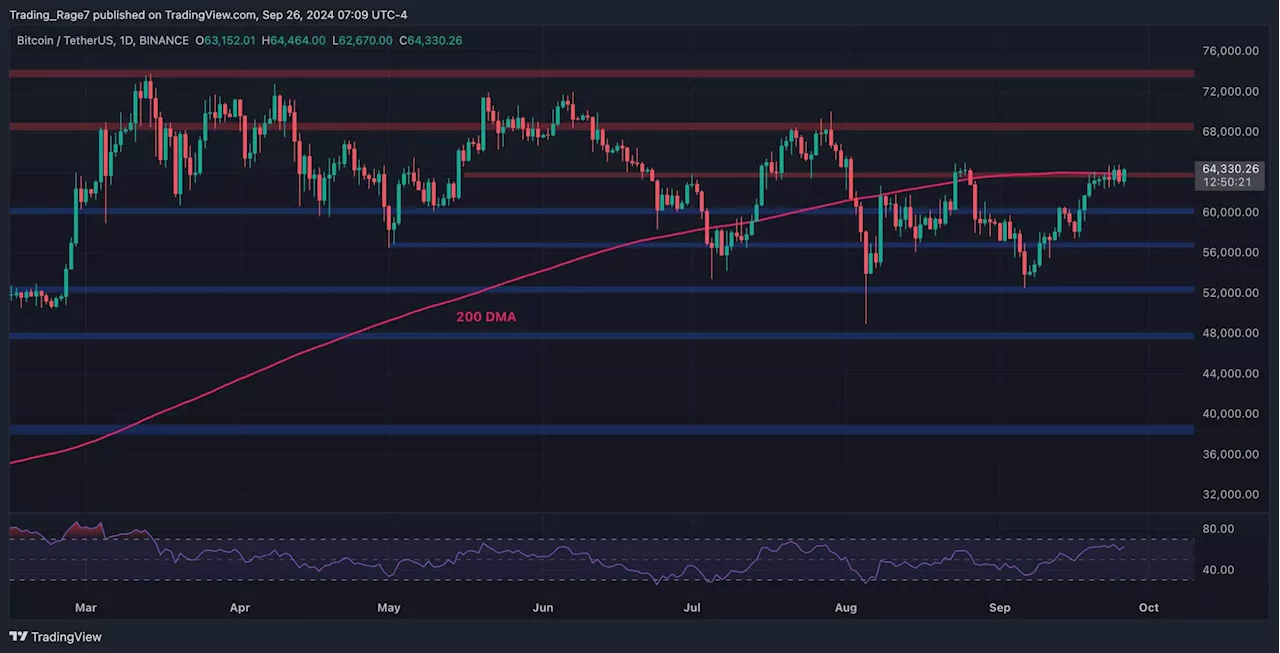
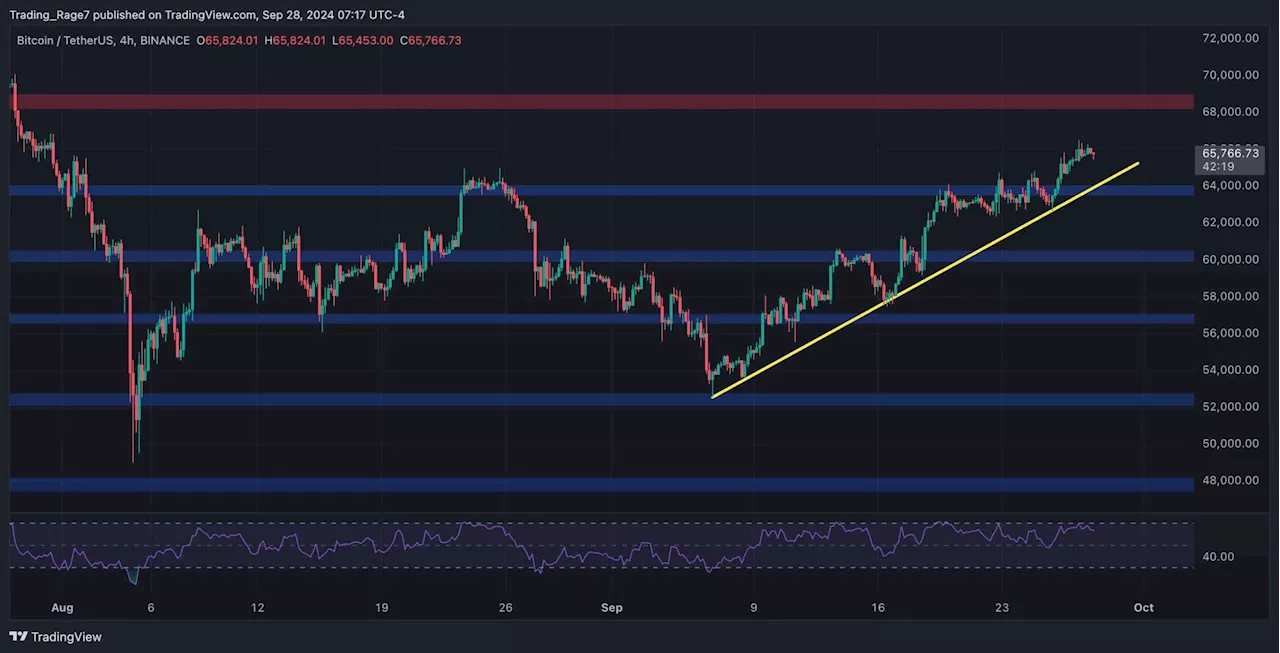
If the daily candle closes above these resistance elements, investors can be optimistic that the market could rally toward the $68K level in the short term.The 4-hour timeframe also shows a completely bullish market structure. The price has finally broken the large bullish flag it has been trapped in for the last few weeks.Therefore, if this breakout proves valid and the price holds above the $64K level, the $68K resistance zone would be a feasible target.
As the chart suggests, funding rates spiked significantly today, as the market is on the verge of breaking above a key resistance level.
United States Latest News, United States Headlines
Similar News:You can also read news stories similar to this one that we have collected from other news sources.
 Bitcoin Price Analysis: BTC Dips to $58K in Anticipation of This Week’s Fed Rate DecissionCrypto Blog
Read more »
 Bitcoin Price Analysis: The Fed Cut Rates, Now What’s Next for BTC?Crypto Blog
Read more »
 Bitcoin Price Analysis: Is BTC Heading Toward $70K or $60K Next?Crypto Blog
Read more »
 BTC Price Analysis: Is Bitcoin Targeting $70K in the Short Term?Crypto Blog
Read more »
 Bitcoin Price Analysis: The Reason Behind BTC’s Crash to $60K TodayCrypto Blog
Read more »
 BTC Price Analysis: Can Bears Push Bitcoin Below $60,000 Soon?Crypto Blog
Read more »